Fintech · UX Design · 2024–2025
CovenantIQ
Quarterly Attestation
Redesigning the covenant reporting process from a fragmented, manual workflow into a streamlined digital product — helping lenders and borrowers move from reactive risk management to a proactive, collaborative partnership.
100%
Borrower adoption — no prompting required
15–20h
Saved per borrower per attestation cycle
4×
More frequent reporting — quarterly to monthly
The Challenge
A fundamentally broken process hidden inside spreadsheets
Before CovenantIQ, covenant attestation was a time-consuming gauntlet. Borrowers sent PDF financial statements to lenders quarterly. Credit analysts then manually spread those PDFs using OCR and spreadsheets to calculate covenant metrics — a process often stretching across weeks, riddled with clarification requests and transcription errors.
The result: lenders only saw borrower financials every 90 days. By the time issues surfaced in a quarterly report, there was rarely enough runway for preventive action. Borrowers, meanwhile, had zero visibility into how their data was being interpreted — they simply sent documents into a black box and waited.
"The old process positioned lenders and borrowers as adversaries working with different data at different times, rather than partners collaborating toward mutual success."
The core pain points were clear: reactive-only risk management, labor-intensive manual work, data accuracy problems, and a complete lack of shared visibility between the two parties who needed to trust each other most.
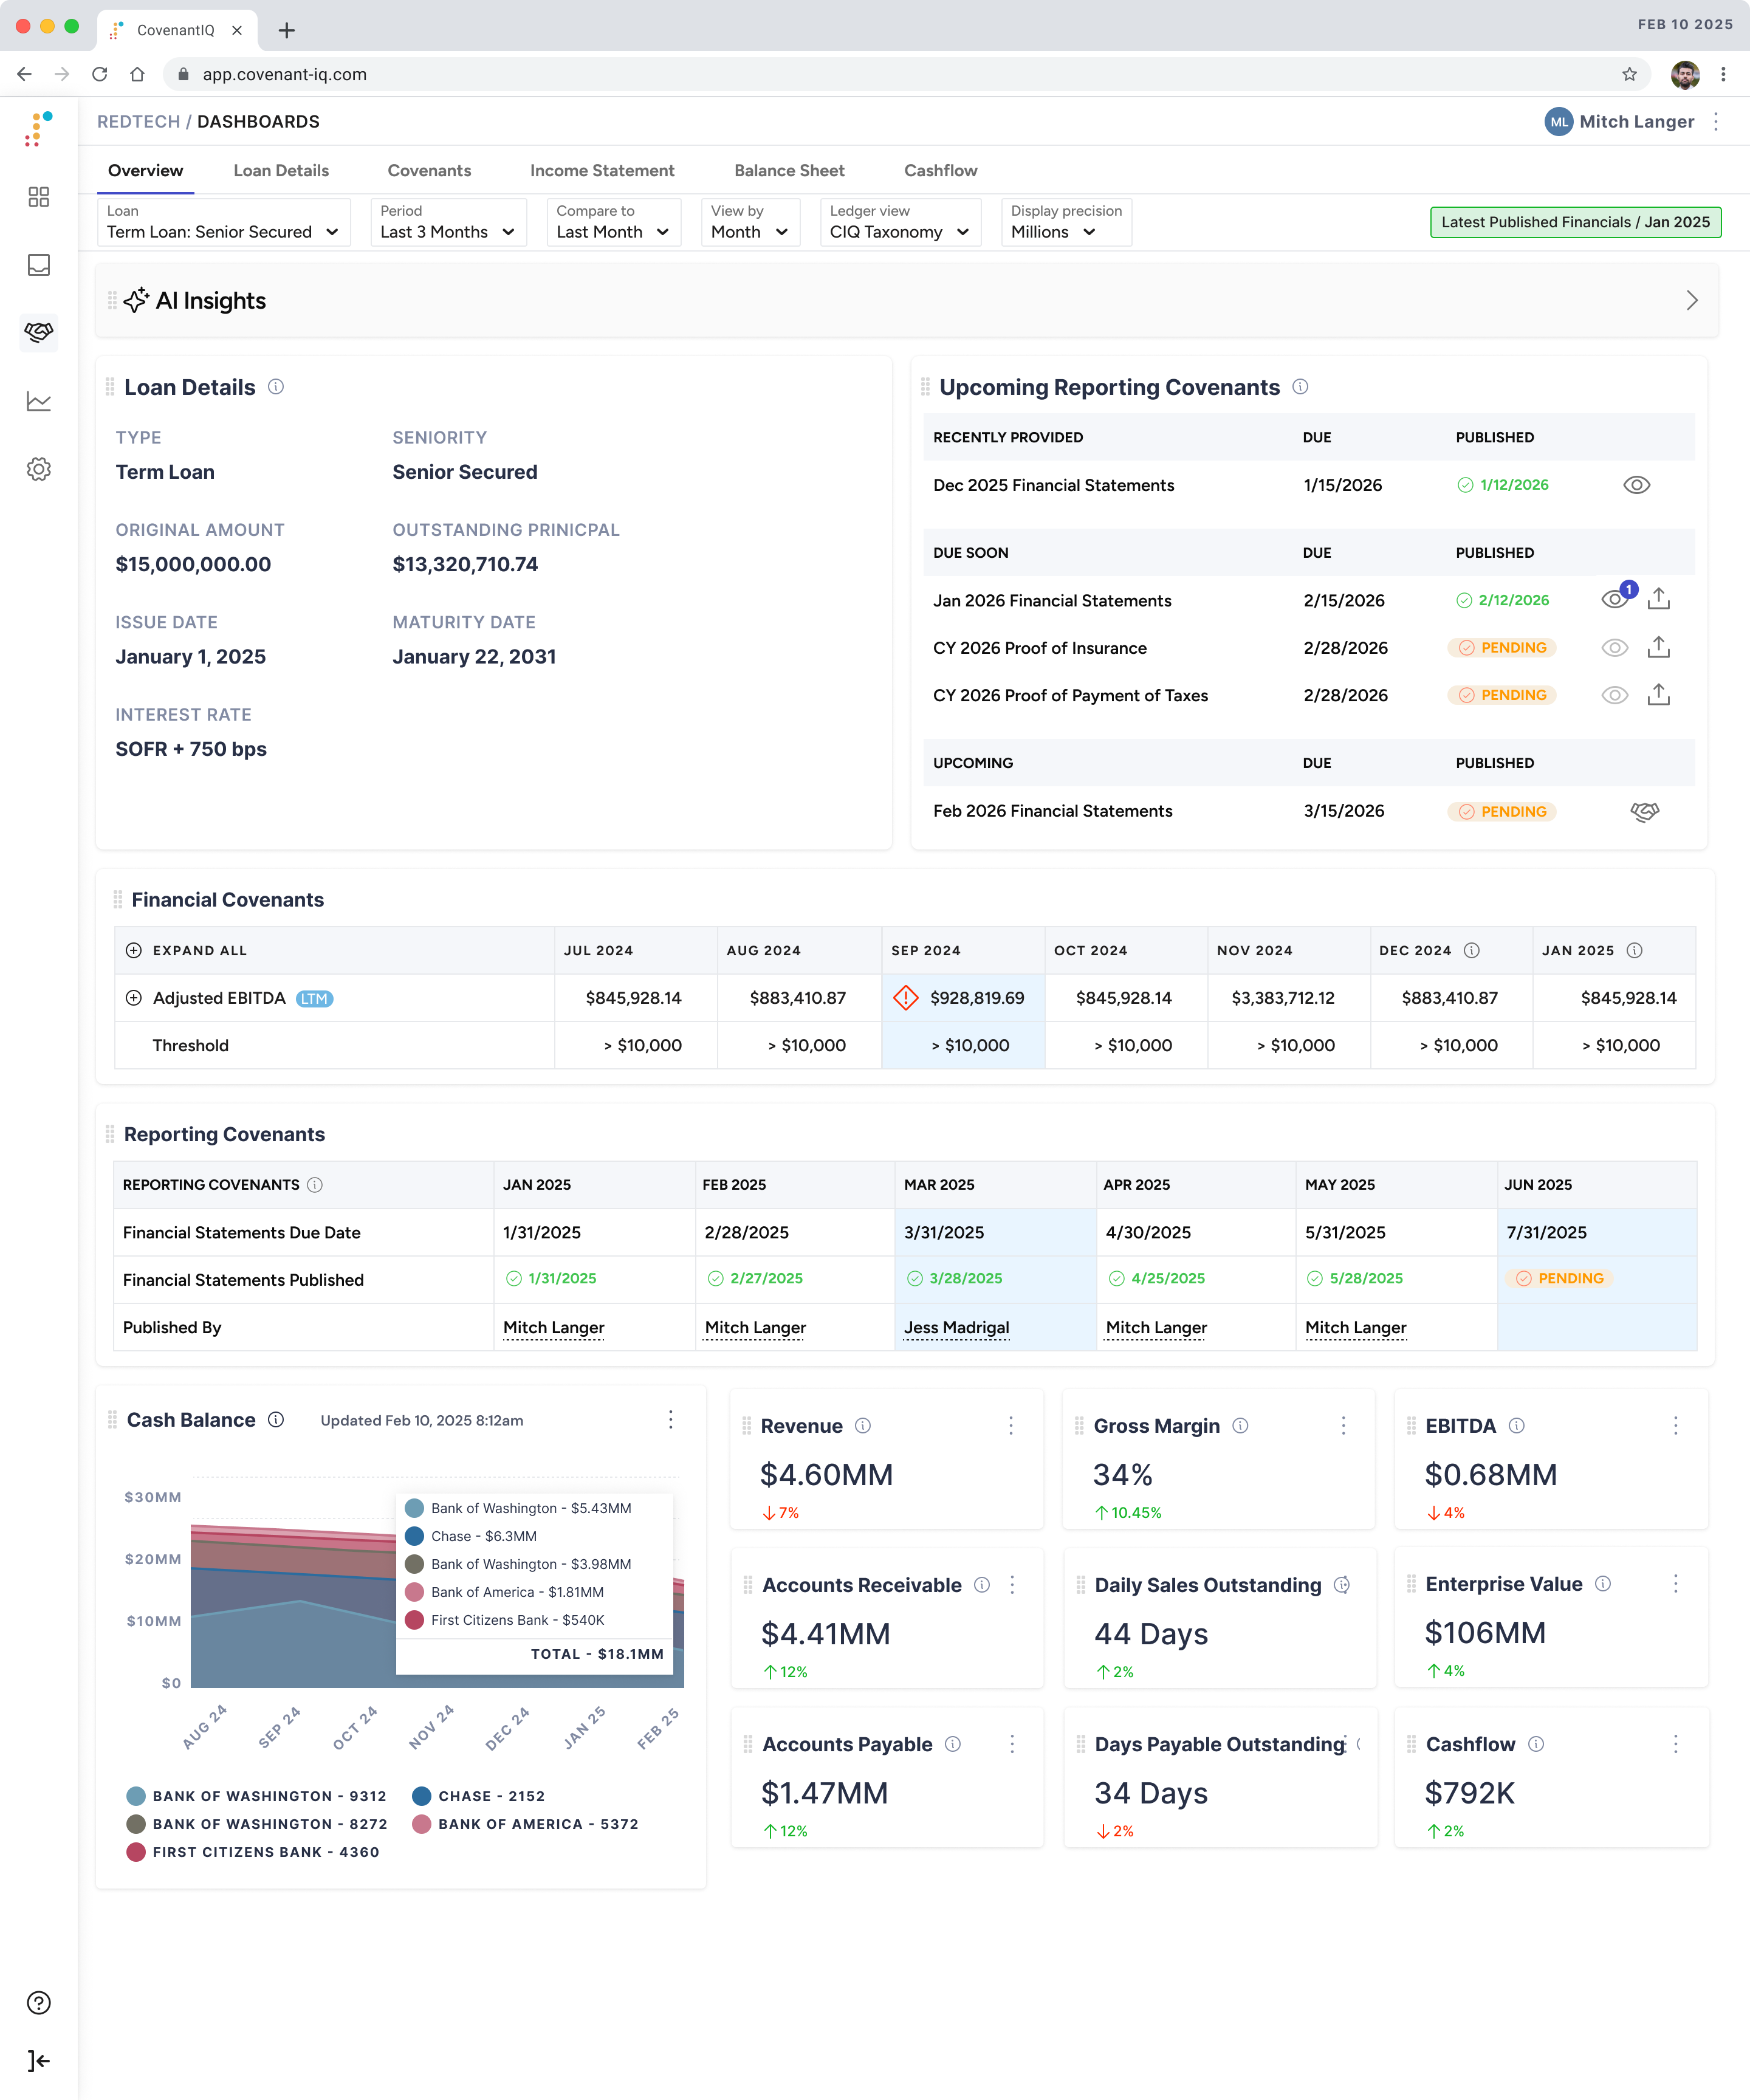
Covenant reporting dashboard — Credit analysts see their entire portfolio in one place, with upcoming attestation deadlines, recently published financials, and financial covenant tracking across all borrowers.
My Approach
A 3-step wizard built around borrower trust
The design pivots on a key insight from early prospect interviews: borrowers didn't want less involvement in the process — they wanted more control and transparency. This ran counter to early assumptions. Rather than minimizing borrower interaction, I leaned into it, designing a flow that gives borrowers full visibility into their data before it reaches the lender.
The attestation flow is a 3-step wizard (4 steps when external debt exists), designed exclusively for the borrower persona:
- Financials — Connect a GL via OAuth or upload statements directly. CIQ maps accounts to a standardized taxonomy. Borrowers preview everything before the lender sees a single number.
- Adjustments — Add EBITDA and cash flow adjustments with required notes. Built-in validation prevents values from exceeding account totals.
- Attest & Publish — Review calculated covenant metrics alongside processed financial statements, then publish to the lender with a single action.
Two major scope pivots emerged mid-project from prospect feedback: adding support for EBITDA and cash flow adjustments (not in the original spec), and splitting the flow to support both monthly publishing and quarterly attestation. The wizard architecture I'd built was flexible enough to absorb both changes without requiring a rebuild.
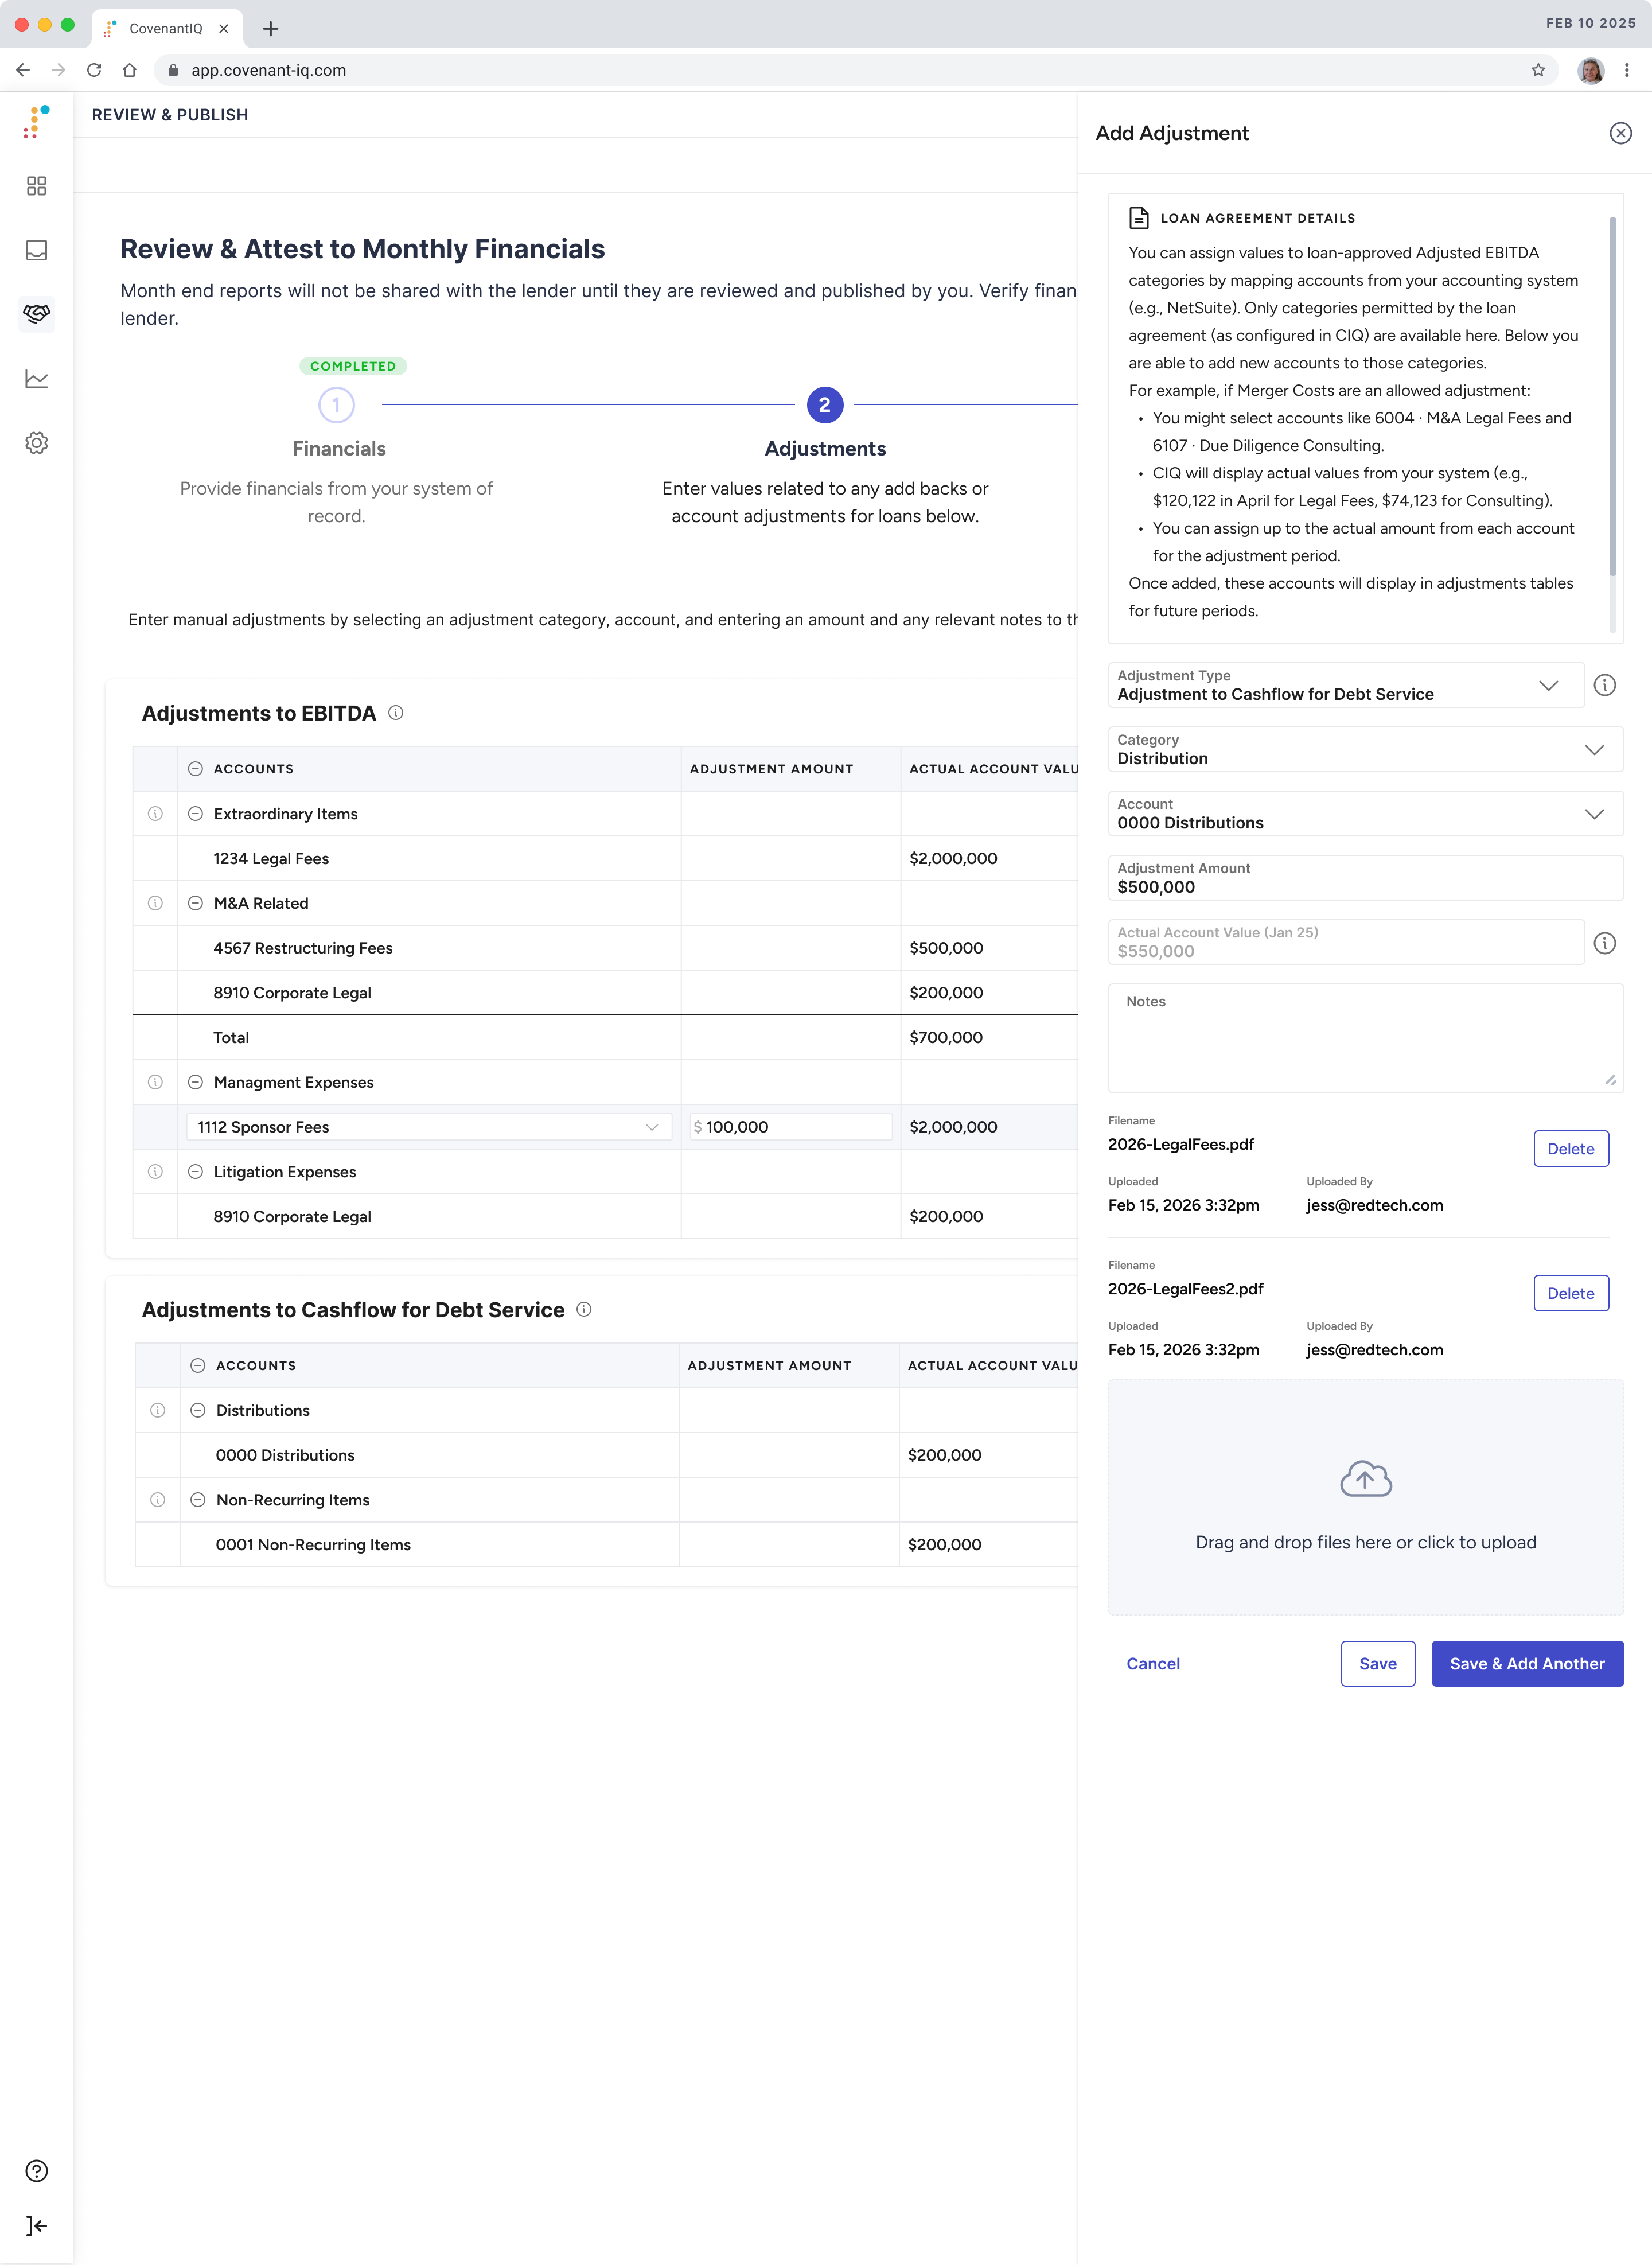
Adjustments step — Borrowers add EBITDA and cash flow adjustments with required notes. Values are validated against actual account totals in real time.
AI Insights — Automated analysis surfaces key questions about borrower financials, giving credit analysts a starting point for deeper review without manual triage.
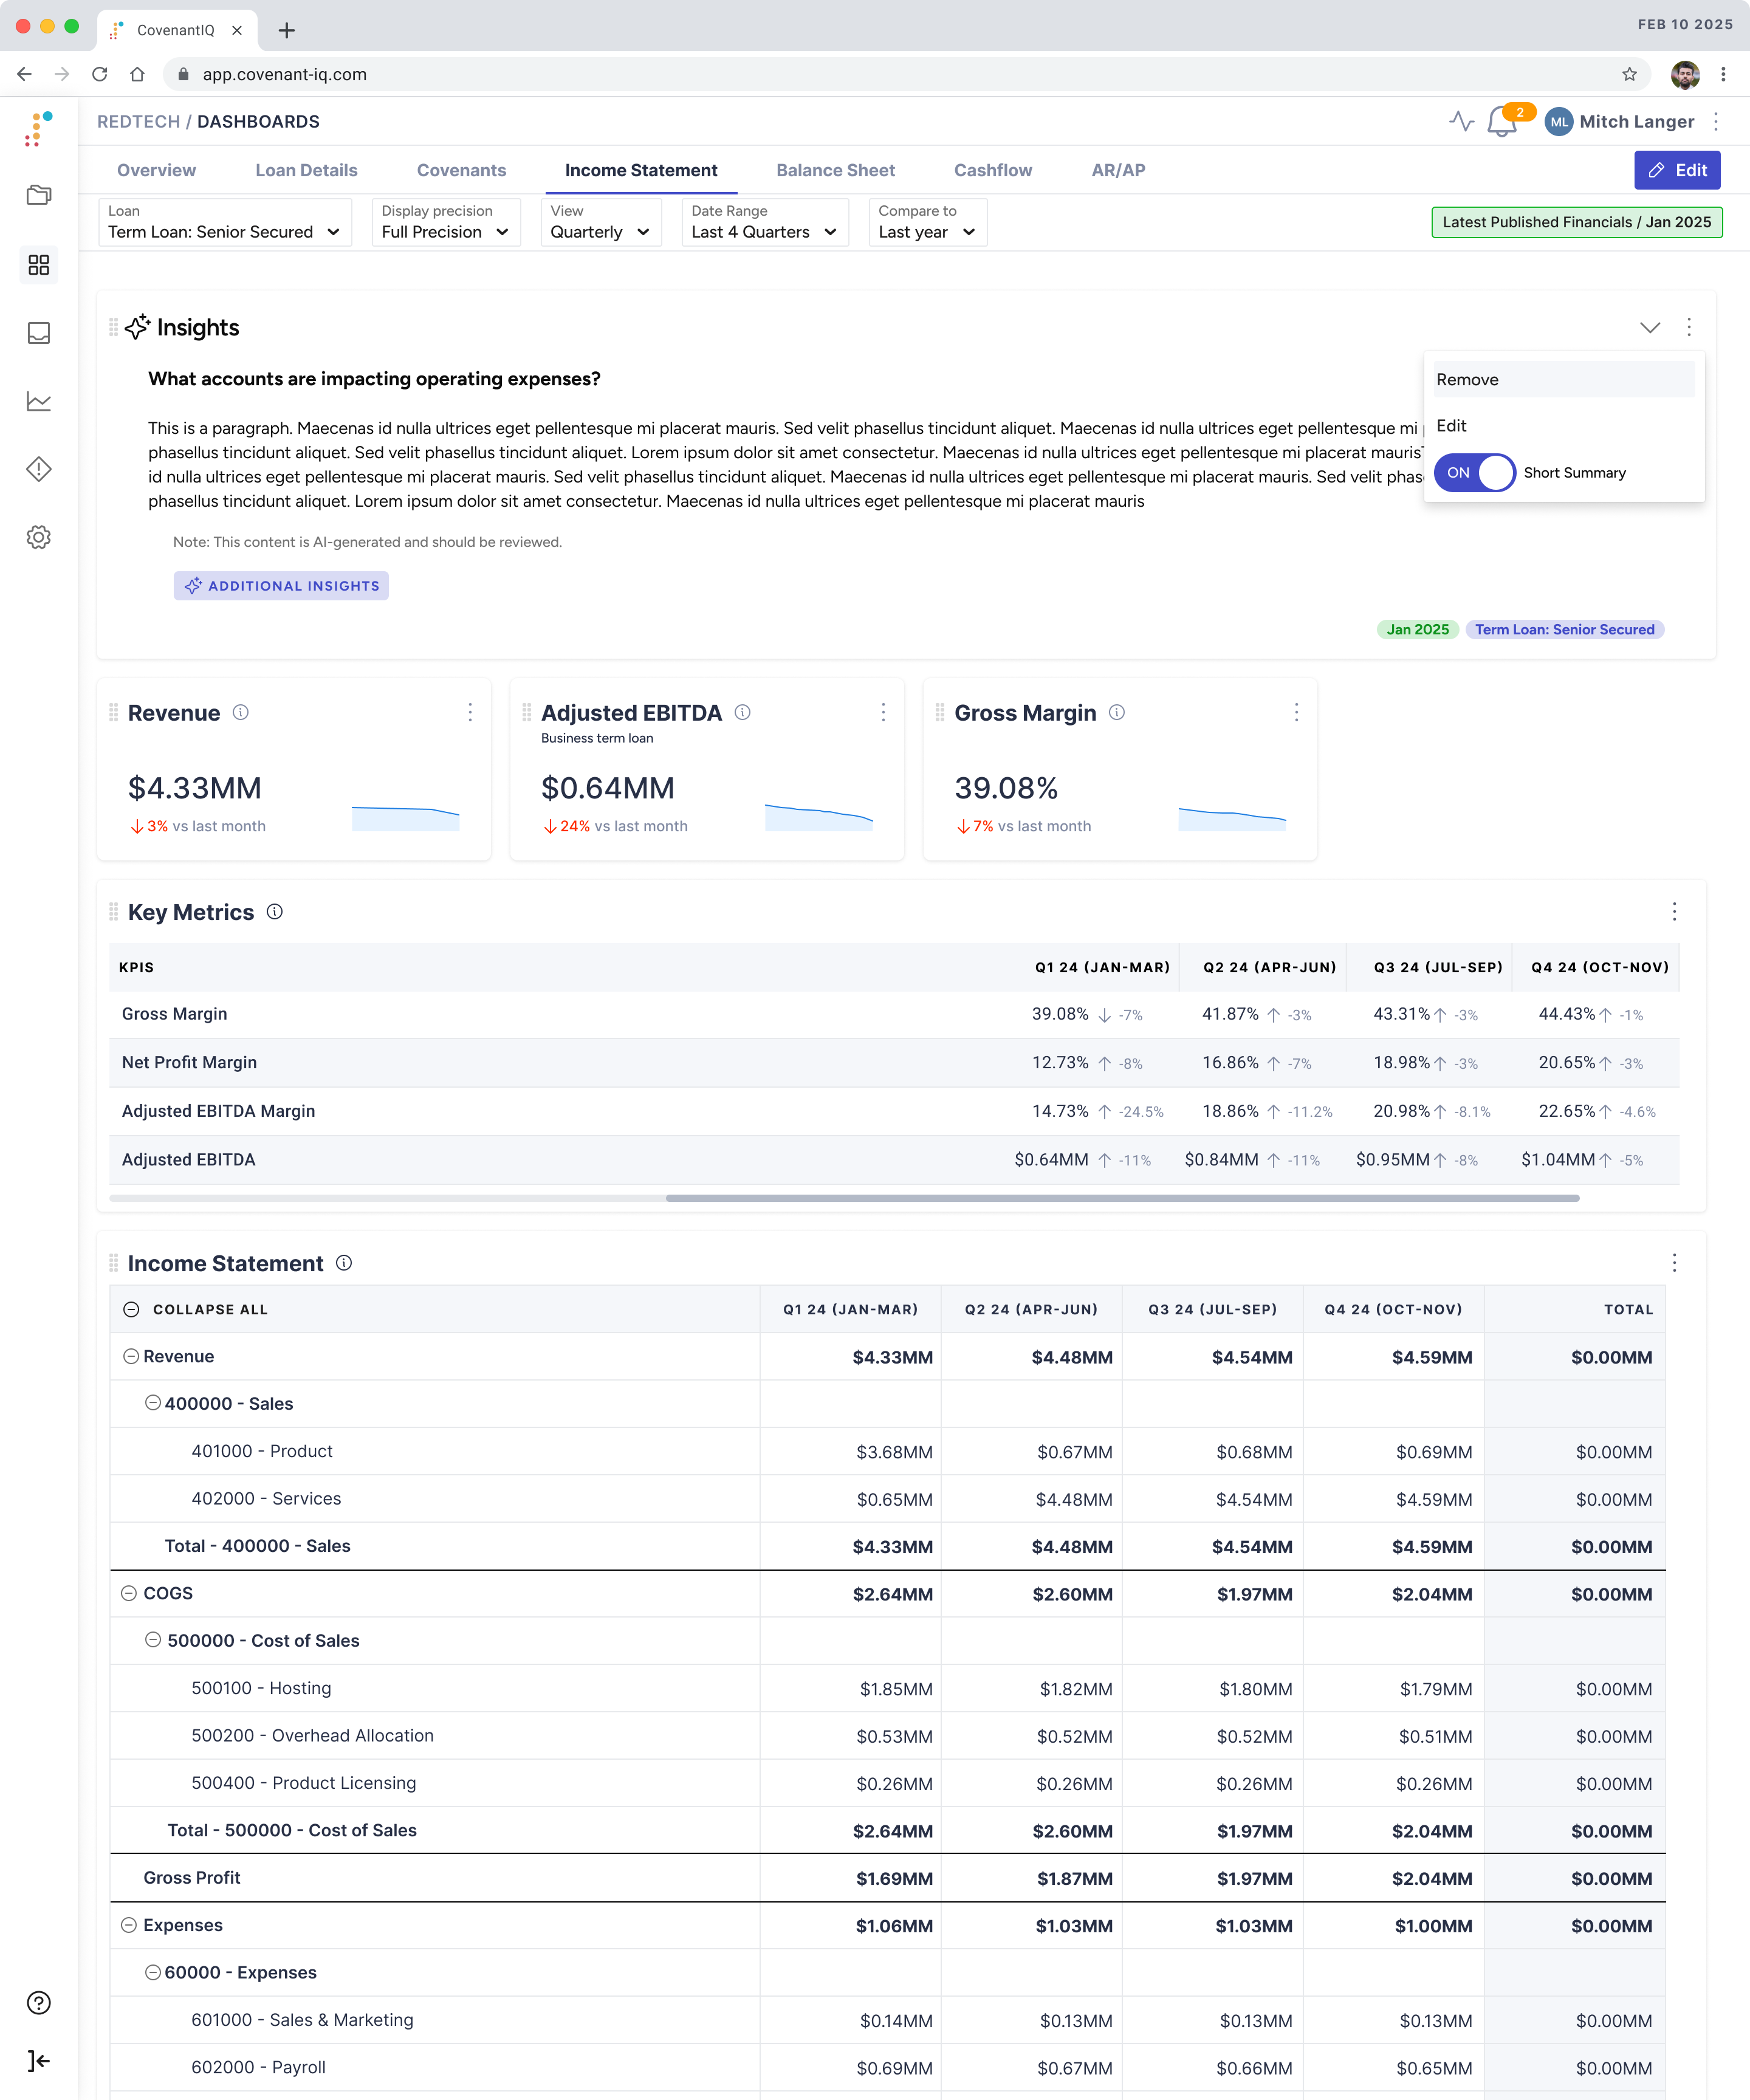
Financial analytics dashboard — Credit analysts see standardized KPIs, covenant calculations, and trend data for each borrower. The same view is available to borrowers before they publish, creating a true shared source of truth.
Key Design Decisions
Designing for complexity without hiding it
The hardest design problem wasn't the wizard flow itself — it was communicating how CIQ's standardized taxonomy differs from each borrower's chart of accounts, and surfacing those differences clearly to users with varying levels of financial sophistication.
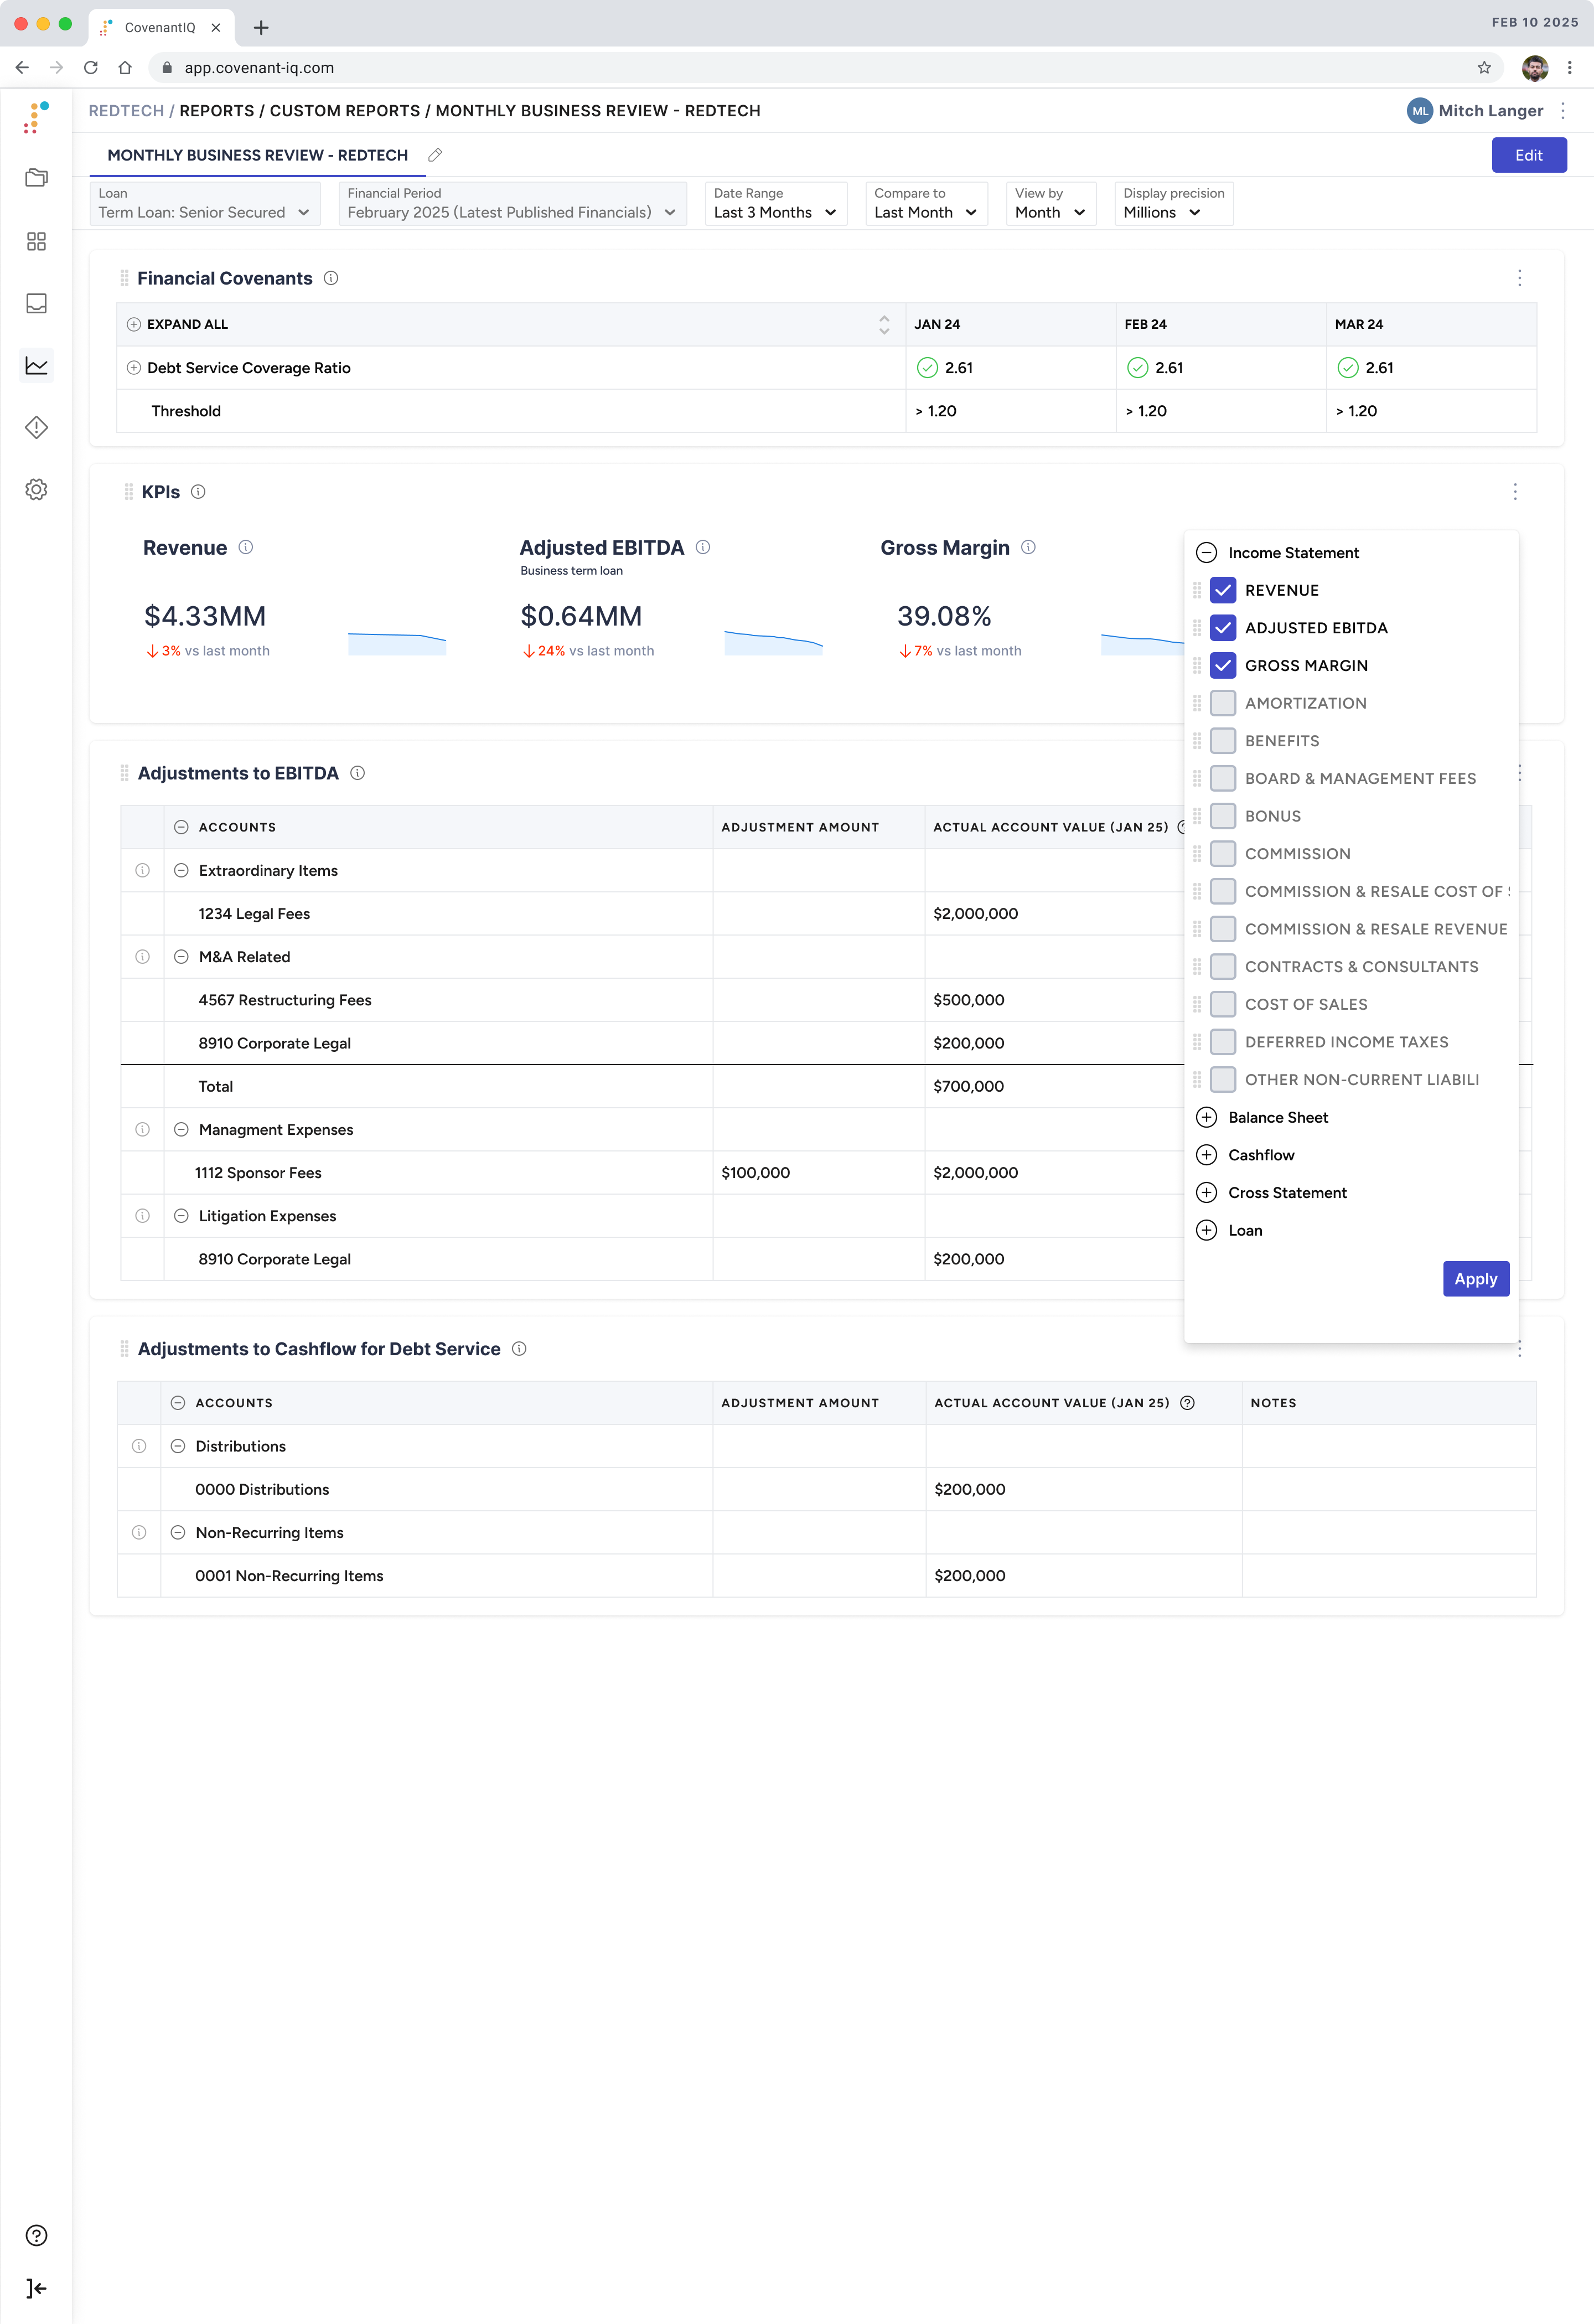
I created a system of colored chips and visual indicators to help users understand how metrics were being aggregated (monthly vs. year-to-date vs. last-12-months), reducing cognitive load in a data-dense interface. Edit and lock states were carefully considered: published months remain editable until a quarterly attestation is submitted, at which point they lock — a nuance that required deliberate visual language to communicate.
The flow adapts dynamically based on system state — whether it's a monthly publish or a quarterly attestation, whether new or changed accounts have been detected, whether external debt exists. Building this flexibility into the wizard component early meant that scope changes during the project didn't require fundamental redesigns.
Outcomes
Exceeded adoption expectations in early beta
The feature launched to 2 lender organizations and 12 active borrowers. The results validated core design assumptions and pointed toward a significant behavior shift driven entirely by ease of use.
100% independent borrower adoption
All 12 borrowers onboarded without analyst assistance — initially a concern, the self-service design proved intuitive enough that no hand-holding was needed.
Quarterly to monthly reporting shift
All borrowers voluntarily moved to monthly publishing (vs. required quarterly). The GL connector made it so easy that doing it monthly became the obvious choice.
15–20 hours saved per cycle
Credit analysts eliminated manual spreading entirely. Time freed up from data wrangling redirected to analysis and relationship management.
Validated borrower transparency model
Borrowers responded positively to seeing the same dashboards lenders see before publishing — a design bet that paid off, deepening trust between both parties.